
A burn rate chart looks simple until you try to use it to choose an actual powder. That is where many reloaders get tripped up. If you want to understand how to read powder burn rates, the first thing to know is that the chart is a reference tool, not a loading manual and not a shortcut around published data.
For experienced shooters and reloaders, that distinction matters. Burn rate charts can help you compare powders, narrow options, and understand why one propellant behaves differently from another. What they cannot do is tell you that two powders sitting near each other on a chart are interchangeable. That assumption causes bad load decisions fast.
What powder burn rate really means
Powder burn rate describes how quickly a smokeless powder generates gas under combustion. In practical terms, faster powders reach peak pressure sooner, while slower powders build pressure over a longer portion of the bullet’s travel. That affects pressure curves, velocity potential, recoil feel, barrel time, and how efficiently a cartridge uses its case capacity.
The key point is that burn rate is relative, not absolute. A powder chart does not usually give you a laboratory number that works like a speedometer. It gives you a ranking. One powder is faster than another, slower than the next, and roughly placed in a sequence that helps reloaders understand general behavior.
That sequence is useful, but only to a point. Burn rate can shift depending on cartridge design, bullet weight, case fill, primer strength, chamber dimensions, and operating pressure. The same powder may feel very well behaved in one application and less flexible in another.
How to read powder burn rates on a chart
When you look at a burn rate chart, read it as a comparison ladder. Powders near the top are generally faster. Powders near the bottom are generally slower. That sounds obvious, but the mistake is assuming the spacing between powders means something exact.
It usually does not.
Two powders listed side by side are not necessarily very close in real-world performance, and two powders several lines apart are not always dramatically different in a given cartridge. Charts are simplified rankings compiled by manufacturers or publishers, often combining information from different product lines. They help organize the field, but they do not replace pressure-tested load data.
A better way to use the chart is to identify a neighborhood rather than an exact substitute. If you already know a cartridge performs well with mid-range rifle powders, the chart helps you stay in that part of the spectrum. If you know a pistol cartridge typically favors fast-burning propellants, the chart helps you avoid looking at powders clearly intended for larger rifle cases.
Why neighboring powders are not interchangeable
This is the part worth slowing down for. Burn rate is only one property of a powder. Grain shape, deterrent coating, bulk density, energy content, temperature behavior, and pressure response all matter. Two powders can live next to each other on a chart and still produce very different results.
That is why published data is tied to a specific powder name, not just a burn speed category. Switching from one powder to another because they appear close on a chart is not load development. It is guessing.
You see this often when a preferred powder is unavailable and a reloader looks for the next closest option. The chart can help generate candidates for research, but the actual decision still comes from tested load data for your cartridge, bullet weight, and intended performance window.
Fast, medium, and slow powders in context
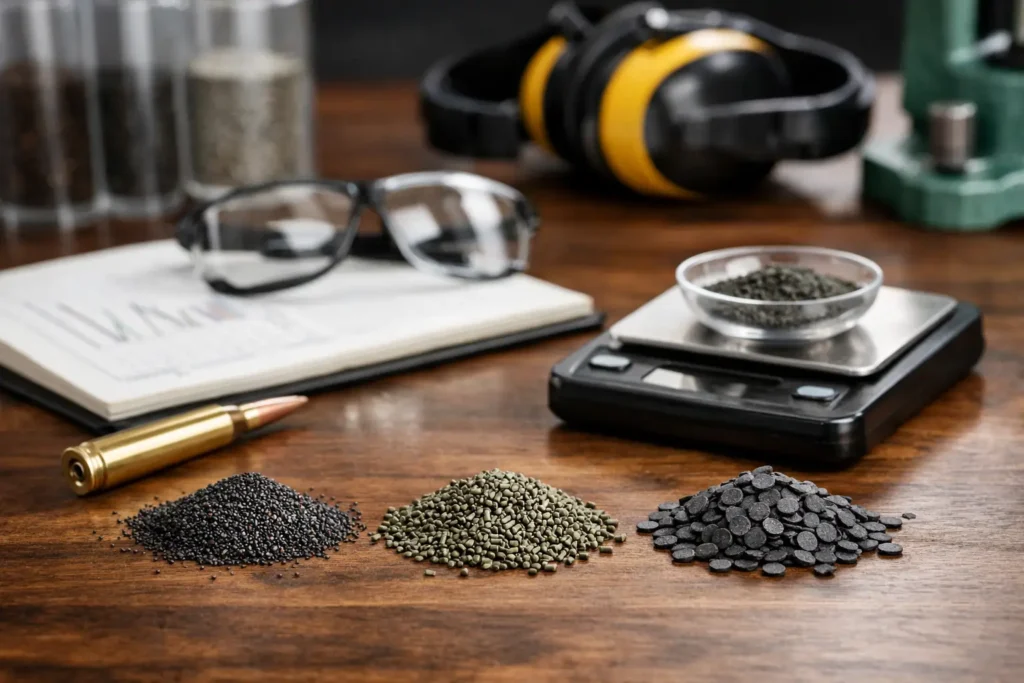
Fast powders generally fit lower-capacity handgun cartridges, light target loads, and some shotshell applications where quick pressure development is desirable. They are efficient, but they also tend to be less forgiving when charge changes create sharp pressure increases.
Medium burn rate powders often sit in the broad utility range. This is where many popular handgun, magnum handgun, and intermediate rifle loads live. Depending on the cartridge, this range can offer a good balance of pressure control, velocity, and metering.
Slow powders are commonly used in magnum handguns and larger rifle cartridges, especially where heavier bullets and greater case capacity benefit from a longer, more progressive pressure curve. They can deliver strong velocity potential, but only when the cartridge gives them enough working room. Put simply, a slow powder in a small case can be a poor fit, even if the charge physically fits.
That is why burn rate has to be read alongside cartridge volume and bullet weight. The chart tells you the family. The manual tells you the match.
Burn rate charts and cartridge efficiency
A useful way to think about powder selection is efficiency. The right powder lets a cartridge reach the desired velocity and pressure with stable ignition and good consistency. A poor match may leave velocity on the table, create excessive muzzle flash, produce erratic standard deviations, or spike pressure earlier than expected.
For example, a very fast powder may reach pressure limits before delivering the velocity a rifle shooter wants with a heavier bullet. A very slow powder may fail to burn efficiently in a smaller cartridge, leaving incomplete combustion and inconsistent performance. Neither result is ideal, even if both powders appear usable in the broad sense.
This is where experienced reloaders get more from a burn rate chart than beginners do. They are not looking for permission. They are looking for pattern recognition.
What a burn rate chart does well
Burn rate charts are excellent for a few specific jobs. They help you understand why a powder is commonly recommended for certain cartridges. They help you compare unfamiliar powders to known references. They also help when supply is tight and you need to identify other powders worth checking in current manuals.
That is especially useful when shopping across major powder lines like Hodgdon, IMR, Winchester, Ramshot, Accurate, Alliant, Vihtavuori, and Shooters World. A chart can show that several brands compete in a similar performance band, even though each powder still requires its own verified data.
For a serious reloader, that saves time. You stop looking at the entire market and start looking at the right segment.
What a burn rate chart does poorly
It does not tell you charge weights. It does not predict safe substitutions. It does not account for every bullet construction, seating depth, or primer combination. It also does not guarantee that one powder will produce the same pressure signs or velocity spread as another in the same apparent burn range.
It is also worth remembering that different burn rate charts are not always identical. Manufacturers may rank their products slightly differently based on testing methods or how they compare blended propellants. If one chart places a powder a few spots higher or lower than another, that does not mean either one is wrong. It means the chart is an approximation.
A smarter way to use burn rate data
If you are evaluating powders for a new load, start with published data for your exact cartridge and bullet weight. Then use the burn rate chart to understand where those recommended powders sit relative to each other. That gives you a practical picture of the pressure and performance window the cartridge tends to like.
From there, think about your goal. If you want clean target loads, your best powder choice may differ from a maximum hunting load. If you want top-end velocity in a long-action rifle, you may end up on the slower side of the acceptable range. If you want metering consistency in volume loading, ball powder behavior may matter as much as burn speed.
This is one of those areas where “better” depends on purpose. The chart helps frame the question. Your data and testing answer it.
Signs you are reading the chart correctly
You are using the chart well if it helps you narrow candidates without treating them as duplicates. You are using it well if you can explain why a cartridge tends to prefer a certain part of the burn spectrum. And you are using it well if every final load decision still goes back to current, pressure-tested data.
That mindset leads to better results at the bench and fewer bad assumptions. It also makes component buying more efficient. When inventory changes, you can quickly identify which powders deserve a closer look and which ones belong in a completely different application.
For reloaders who care about consistency, safety, and field performance, that is the real value. Burn rate charts are not magic, and they are not filler content for manuals. They are a practical reference for understanding powder behavior in context.
Read them that way and they become genuinely useful. Read them as a substitution chart and they become expensive education.
The best reloaders rarely ask, “What is closest on the chart?” They ask, “What does this cartridge actually want?” That question will take you farther than any ranking ever will.